Ichimoku Kinko Hyo
This is a brief little summary about Ichimoku Kinko Hyo. If you want a deeper insight of the Ichimoku Kinko Hyo technique, you can watch the manifold videos available on my YouTube channel dedicated to Ichimoku and Japanese Candlesticks here: Ichimoku YouTube Channel
In case you wish to proceed further, check out my courses here: Ichimoku Kinko Hyo The Complete Course and The Japanese Candlesticks Course.
Read reviews from people who bought the courses here: GUESTBOOK
Ichimoku Kinko Hyo translates to "one glance cloud chart".
Indeed, Ichimoku is a tool designed for the technical analysis of the financial markets which allows you to visualize the trend instantly (bearish, bullish or range), along with the support and resistance levels. And all this is done over several simultaneous timeframes.
The Ichimoku technique was created by Japanese journalist Goichi Hosoda. He developed this technique because he wanted to understand the movements and the trends of the rice market. This is why he relied on his analysis and observations of the rice market in order to create the Ichimoku System.
After more than 30 years of research that required the help of hundreds of students who conducted the manual backtesting, Hosoda finally published a book about his trading system in 1968.
Ichimoku Kinko Hyo was born
However, it was not until the 1990s that Western trading rooms began to take an interest in Ichimoku. Until then (probably because of inaccurate translations), it was only perceived as yet another exotic indicator. But nowadays Ichimoku has become more and more popular. Many books and websites about Ichimoku are available to the public presently, but beware - most of the Ichimoku related content that you can find on the internet is false.
Ichimoku suits every trading style (scalping, intraday, swing trading). It is effective regardless of how long you wish to keep your positions (short, medium and long-term).
The strength of Ichimoku Kinko Hyo lies in its simplicity, regardless of what asset or timeframe you use, allied with its powerful ability to deliver dynamic analysis.
Ichimoku Kinko Hyo is a complete trading system that is sufficient to achieve success on its own. Nonetheless, it is relevant and effective to combine it with basic chartist line techniques (oblique and horizontal lines, support and resistance lines). And obviously knowing how to interpret Japanese Candlestick Patterns will tremendously improve your technical analysis.
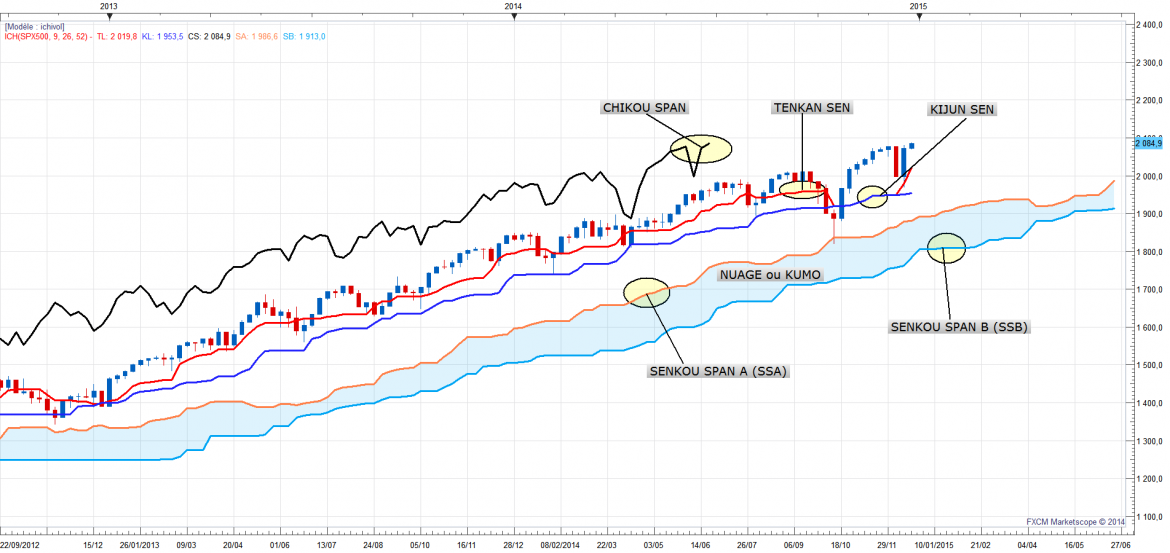
Ichimoku Kinko Hyo was born Charts were created with FXCM Marketscope 2, click to enlarge.

The Ichimoku trading system can be broken down as follows:
- The Tenkan-Sen (red line on the graph)
- The Kijun-Sen (blue line on the graph)
- The Chikou-Span (black line on the graph) This line is also sometimes called the lagging span.
- The Senkou-Span A (the orange line of the cloud)
- Senkou-Span B (the blue line of the cloud)
The Ichimoku charts inform us about:
- The equilibrium of the market (in the blink of an eye we can see if we are in a trending or in a range market);
- The support and resistance levels
- The strength of the trend (momentum).
In a trending market, Ichimoku allows us to trade:
- After a pullback or a throwback;
- After a break
In a range market:
- In this case, Ichimoku charts must be interpreted and used in a totally different way. Ichimoku delivers lots of precious information for trading a range market.
The settings of Ichimoku
When Ichimoku was created, the stock exchange schedule was different from today, yet we continue to use settings reflecting the old market calendar. In order to adjust to the current market calendar, some people set the indicator to 7.22.44, but I instead recommend that you keep the settings by default. This is because almost all the traders who use Ichimoku use the original settings. An indicator will therefore necessarily be more accurate when everyone sees the same thing, or gets the same information at the same time (this is related to crowd psychology).
The correct settings are 9.26.52:
- 9 stands for one and a half week of trading days during the times Ichimoku was created.
- 26 stands for the number of trading days in a month (without the Sundays).
- 52 stands for two months of trading days.
You are welcome to visit my Ichimoku Blog where you can read for free many articles about Ichimoku, and how to use it.

